Traders of Environmental Progress
STX Group is a global environmental commodities trader offering physical and financial solutions across compliance and voluntary systems for energy, fuels, gas and carbon markets.


Traders of Environmental Progress
STX Group is a global environmental commodities trader offering physical and financial solutions across compliance and voluntary systems for energy, fuels, gas and carbon markets.

Transforming Climate Challenges into Business Progress
STRIVE is the advisory arm of STX Group, helping companies meet climate targets through high-impact strategies and cost-efficient decarbonization pathways.
Blog
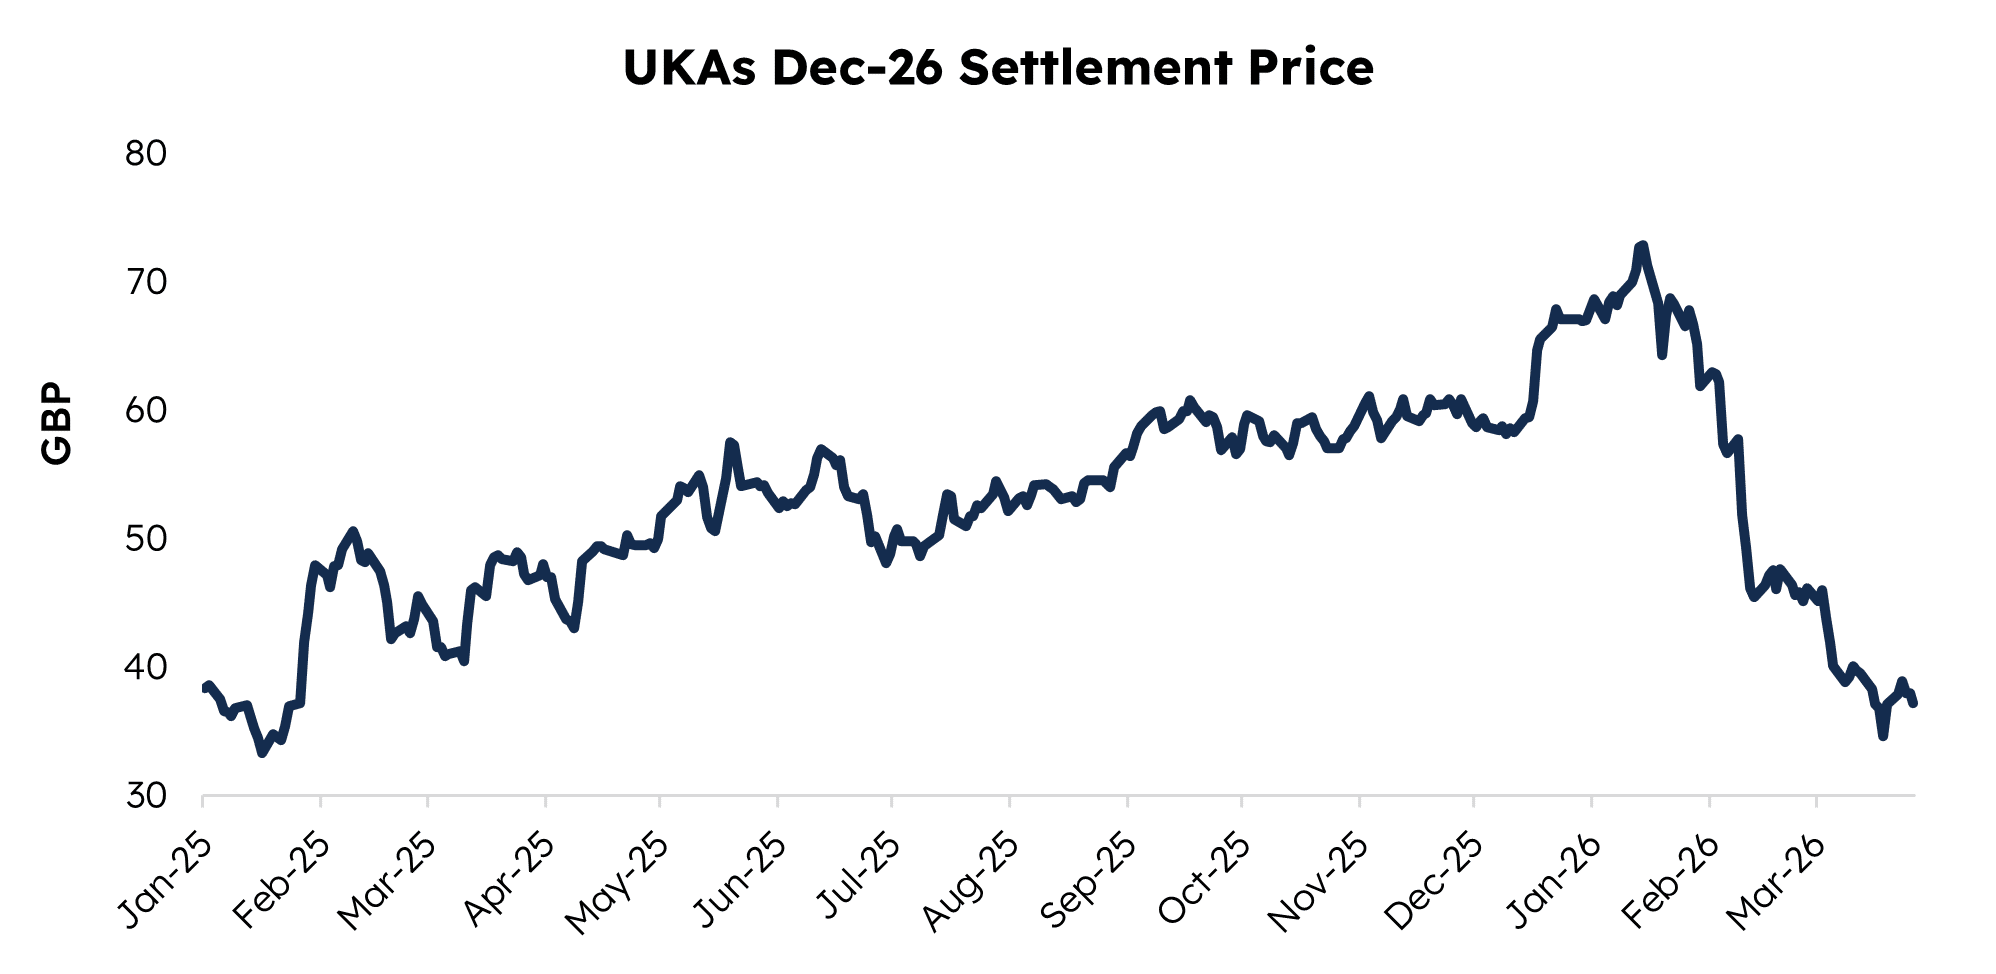
On 15 January 2026, ICE Dec-26 UKA futures hit an intraday high of £75.45, closing at £72.88. The sterling-equivalent spread to Dec-26 EUAs had compressed to around £5 per tonne, pricing near-full convergence.
Just nine weeks later, on 19 March, the same contract closed at £34.67, reopening the UKA-EUA spread to around £20, or 35% of the EUA-equivalent price.
The round trip points to a two-regime market: one in which the UK ETS remains a standalone, structurally oversupplied market, and one where it becomes a satellite of the EU ETS. But the crash introduced a third variable: the EU ETS itself is under political siege, with emergency supply measures, calls for suspension, and a geopolitical energy shock. If the EU benchmark itself is shifting, the spread becomes harder to price.
To understand why the spread moved from near-convergence back to deep discount, it helps to break the period into three distinct rallies followed by a sharp reversal.
January–February 2025: The First Linkage Trade
As 2024 drew to a close, the Dec-26 UKA contract continued to trend downward. The contract fell from £41.25 on 19 November 2024, to an intraday low of £33.34 on 17 January 2025. Sentiment then shifted sharply. On 28 January, a press release said the UK had requested ETS linkage to be included in upcoming talks with the EU. That day, the contract jumped 12.8%. It then continued rising, reaching £50.60 by 10 February, representing a 52% increase in just 24 days. By comparison, the equivalent EU carbon contract rose only 4% over the same period. As a result, the price gap between the two markets narrowed from about £35 to around £21.
May 2025: The Common Understanding
After the press releases in the first quarter, the next key moment came at the EU-UK Summit on 19 May, where both sides issued what became known as the Common Understanding. This signalled a shared commitment to pursuing future ETS linkage. The Dec-26 UKA contract rose 13.2% over two sessions, from £50.61 to £57.55, while the price gap with EU allowances narrowed to around £6. Over the summer and autumn, UKAs traded in a £50–£61 range, supported by steady institutional buying and position rolling around major political developments.
October 2025–January 2026: The Grind Higher
Following the summer and EU ETS compliance season, the EU Council’s negotiating mandate on 13 November had only a limited immediate impact on UKAs, with prices moving less than 1% on the day. Even so, market interest had already been building. Since mid-June, aggregate Open Interest (OI) had risen from the low-70 million range to above 80 million, helped by the European Commission’s July draft, which gave investors more confidence in the linkage story.
That trend strengthened after the 17 December EU-UK joint statement said both sides were targeting linkage by mid-2026. UKAs then moved above £65 for the first time since April 2023. Expectations built further when Reuters reported on 14 January that formal negotiations would begin the following week. The Dec-26 UKA contract rose to an intraday high of £75.45 on 15 January and closed at £72.88, about 20% above its 17 December level of £60.71.
Price action alone does not capture how crowded the linkage trade had become; positioning and volatility data show a market growing increasingly one-sided by early 2026. 60-day realised vol fell steadily through the second half of 2025, but this changed in January 2026, suggesting that uncertainty was returning as a more meaningful market factor.
Fund net length generally increased alongside UKA open interest through much of 2025, though the relationship was not perfectly consistent. When open interest softened in spring, fund positioning remained broadly elevated, and while open interest rose again into summer, fund length only rebuilt more clearly later in the year.

By the January peak, UKAs were pricing near-full convergence with the EU, leaving the market highly exposed when that narrative began to crack. The drop was faster than any preceding rally. Dec-26 UKA fell from £72.88 on 15 January to £64.28 on 20 January (−12%), then to £61.89 by the end of January.
What Triggered the Reversal? No single catalyst explains a 52% drawdown. Instead, multiple shocks hit a heavily crowded trade, where most investors were positioned the same way.
These positioning dynamics are best understood through the spread, where convergence optimism and political doubt were most clearly reflected.
From ~€42 in Jan 2025, the UKA – EUA spread compressed in three stages: ~€18.6 (Jan–Feb 2025 rally); ~€6.7 (May 2025 Common Understanding); ~€8 (15 January 2026 peak). By 23 March, it was back to ~€25.
The spread broke sharply toward the −2 sigma band in February, a level visited only once before (January 2025 dislocation). Historically, −2 sigma touches have preceded mean reversion. But every prior touch occurred with the political trajectory intact; this time, it is deteriorating.

What the spread now reflects is not simply the probability of linkage, but the credibility of the policy framework on both sides. The rallies of 2025 and January 2026 showed how quickly UKAs can converge when the market believes political alignment is real. The crash showed the reverse: when that belief weakens, convergence can unwind violently. For now, the structural linkage thesis remains alive, but it is no longer enough on its own. UKAs will need not just progress in negotiations, but renewed confidence that carbon pricing remains politically durable in both London and Brussels.

On May 19, the World Bank released its annual State and Trends of Carbon Pricing 2026 report , one of the most comprehensive analyses of the evolution of global carbon.....